
Map Picks and Bans


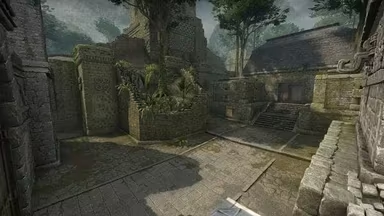

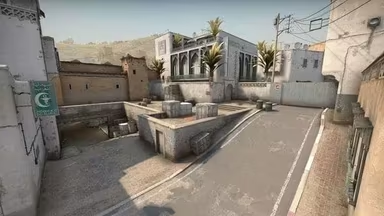
Do you know who will win next?
People who bet 100$ won 125$
Don’t miss your chance next time!


Player comparison


Head to head
Previous matches
Procyon
Los Ninos
Info
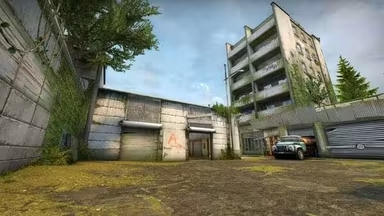
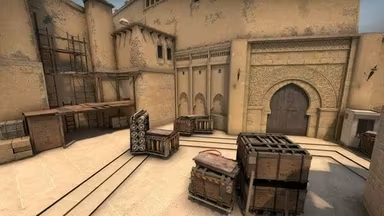
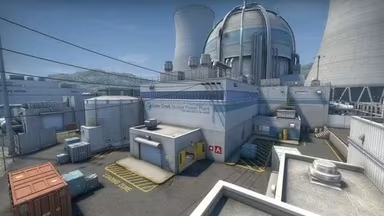
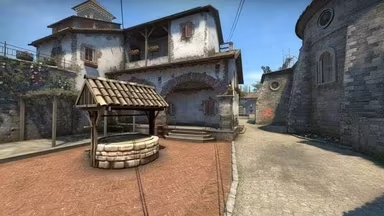
Check Procyon vs Los Ninos full CS2 match result & analysis from CCT South America 2026 Series #7, played as a BO3 series with Procyon winning 2 : 1. Dive into map-by-map statistics: round scores, team economy, ADR leaders, K/D ratios, Headshot %, and player performances for key fraggers like laser, lenci, MaxOff, pavv, next, aNgelo, reix, space, protado, PremiuM.
Analyze Utility Damage, Entry Fragging success, and tactical breakdowns - which maps were played, how the T-Side and CT-Side influenced rounds, and the impact of the final Clutch plays. Compare performance trends like First Kill Advantage and round efficiency to see how Procyon responded under pressure and where Los Ninos outperformed them.
Use head-to-head (H2H) past results, team vs team history, and recent form to contextualize the result and understand momentum going forward. Ideal for fans, analysts, and bettors seeking match analytics, CS2 meta insights, map trends, and post-match breakdowns. Find replay links, match timeline visuals, and filter by map, player, and date to explore details.
